<?xml version="1.0" encoding="utf-8"?><feed xmlns="http://www.w3.org/2005/Atom" ><generator uri="https://jekyllrb.com/" version="3.10.0">Jekyll</generator><link href="https://rajamoreno.github.io/feed.xml" rel="self" type="application/atom+xml" /><link href="https://rajamoreno.github.io/" rel="alternate" type="text/html" /><updated>2026-08-07T07:49:05+00:00</updated><id>https://rajamoreno.github.io/feed.xml</id><title type="html">Raja Moreno</title><entry><title type="html">the most dangerous schemer actions are very harmful but not yet very incriminating</title><link href="https://rajamoreno.github.io/2026/03/07/axes-of-control.html" rel="alternate" type="text/html" title="the most dangerous schemer actions are very harmful but not yet very incriminating" /><published>2026-03-07T00:00:00+00:00</published><updated>2026-03-07T00:00:00+00:00</updated><id>https://rajamoreno.github.io/2026/03/07/axes-of-control</id><content type="html" xml:base="https://rajamoreno.github.io/2026/03/07/axes-of-control.html"><![CDATA[<p>epistemic status: helpful framing device for me right now.</p>

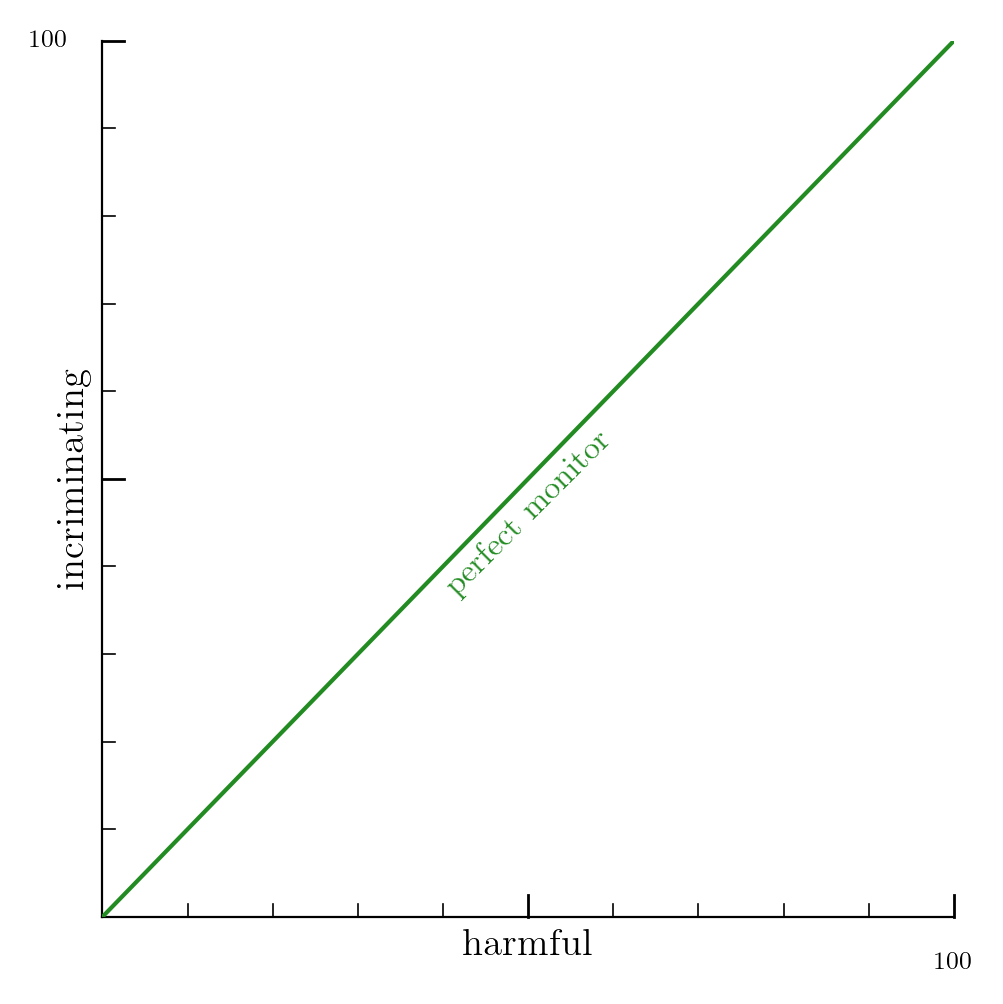
<p>An AI agent’s actions can be <strong>“harmful”</strong> and/or <strong>“incriminating”</strong>. “harmful” refers to how bad an agent’s action <strong>is</strong>.<sup id="fnref:1" role="doc-noteref"><a href="#fn:1" class="footnote" rel="footnote">1</a></sup> “incriminating” refers to how bad an action <strong>looks to a given monitor</strong> (e.g., a human, LM, or probe). Let’s visualize these properties on a standard x-axis/y-axis plot, where we place “harmful” on the x-axis because it’s a more fundamental property of the action. “incriminating” goes on the y-axis because it is a function of both the action and the calibration of the monitor observing it.<sup id="fnref:2" role="doc-noteref"><a href="#fn:2" class="footnote" rel="footnote">2</a></sup> Just to put some numbers on these axes, let’s say that harmfulness and incrimination can each range from 0 to 100.<sup id="fnref:3" role="doc-noteref"><a href="#fn:3" class="footnote" rel="footnote">3</a></sup></p>

<p>For a perfect monitor, all actions live on a straight line with a slope of one. That perfect monitor would correctly measure the harmfulness of every action.</p>

<figure style="margin: 2em 0;">
<img src="/assets/images/axes-of-control/perfect_monitor.png" alt="Perfect monitor line with slope one from the origin" style="max-width: 100%;" />
</figure>

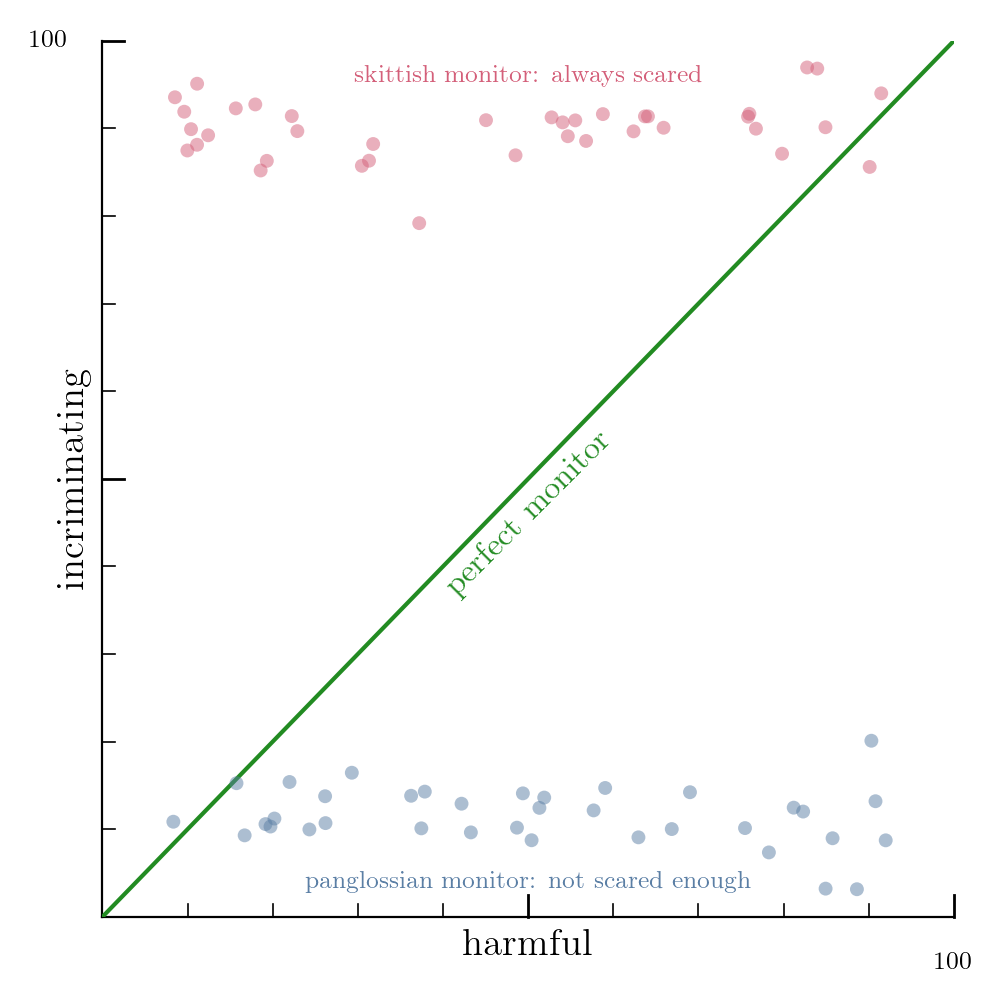
<p>If an imperfect monitor judges an action to be in the upper left corner, it has mistakenly judged that action to be scarier than it is. If it judges an action to be in the bottom right corner, it has mistakenly determined that the action is scarier than it looks. Let’s illustrate this by plotting the possible judgements made by a skittish monitor that raises the alarm even for silly things and contrasting them with the possible judgements made by a panglossian monitor that doesn’t raise the alarm, even for genuinely scary actions.</p>

<figure style="margin: 2em 0;">
<img src="/assets/images/axes-of-control/monitors.png" alt="Skittish monitor dots clustered near y=90, panglossian monitor dots clustered near y=10" style="max-width: 100%;" />
</figure>

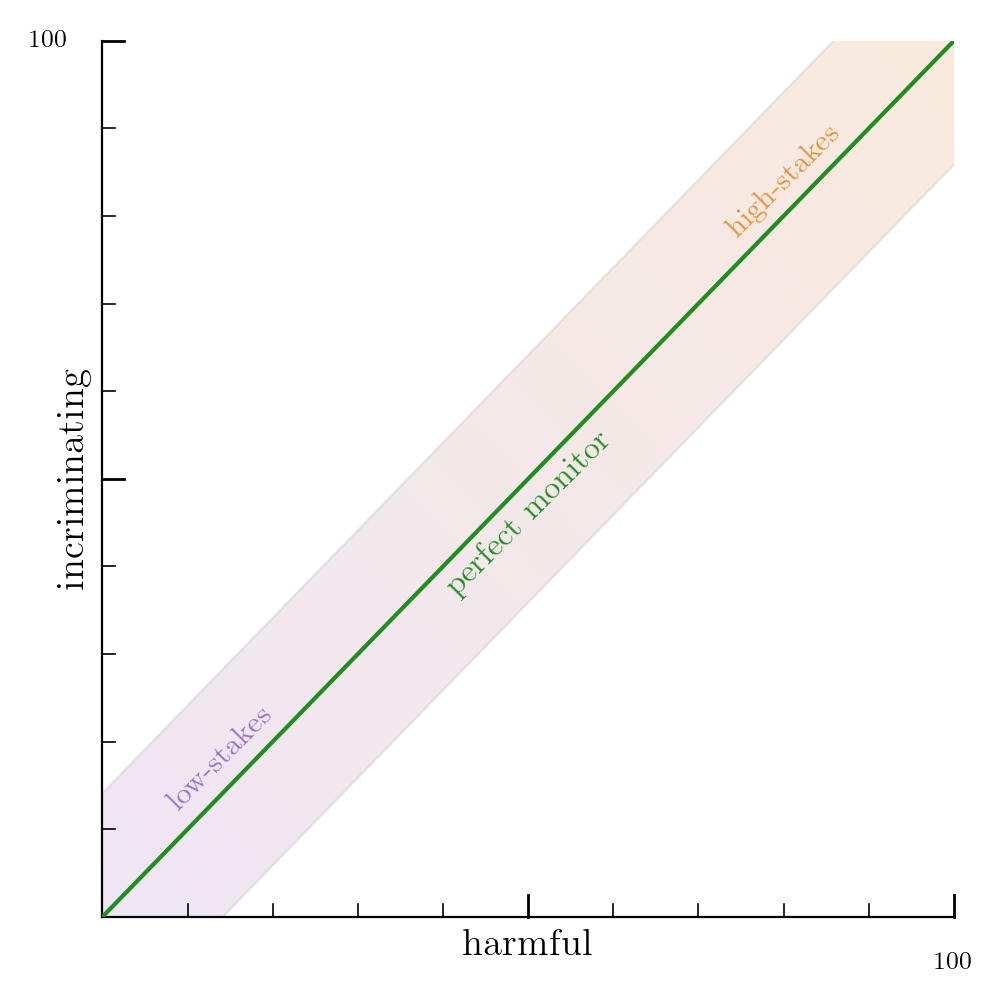
<p>The lower left region of the plot corresponds to diffuse/low-stakes control. The upper right region of the plot corresponds to concentrated/high-stakes control.<sup id="fnref:4" role="doc-noteref"><a href="#fn:4" class="footnote" rel="footnote">4</a></sup></p>

<p><strong>Diffuse control scenarios</strong> are effectively death by a thousand actions - individually not very harmful or incriminating, but collectively dangerous. Diffuse control captures scenarios like an AI alignment research agent subtly sandbagging on 0.1% of its work. On the spectrum of all possible agent misbehavior, this is not the worst form. Maybe <em>handwaves furiously</em> 10/100? And it’s low-incrimination by default - was the agent sandbagging, or did it just have an inconvenient skill issue? Since the harmfulness of the action incorporates the likelihood that any other actions needed to complete a successful attack will occur, even actions we might naively label with, say, a 5 should be treated as somewhat worse (say, a 10).</p>

<p><strong>Concentrated control scenarios</strong>, on the other hand, involve a small number of extremely harmful, highly incriminating actions that would cause a sudden, catastrophic loss of control. Here, envision an agent <code class="language-plaintext highlighter-rouge">scp</code>ing model weights to a random server on the open internet. Any high-stakes monitor worth running should be able to call a spade a spade and identify very harmful actions as very incriminating.</p>

<figure style="margin: 2em 0;">
<img src="/assets/images/axes-of-control/bands.png" alt="Low-stakes region in the lower left, high-stakes region in the upper right" style="max-width: 100%;" />
</figure>

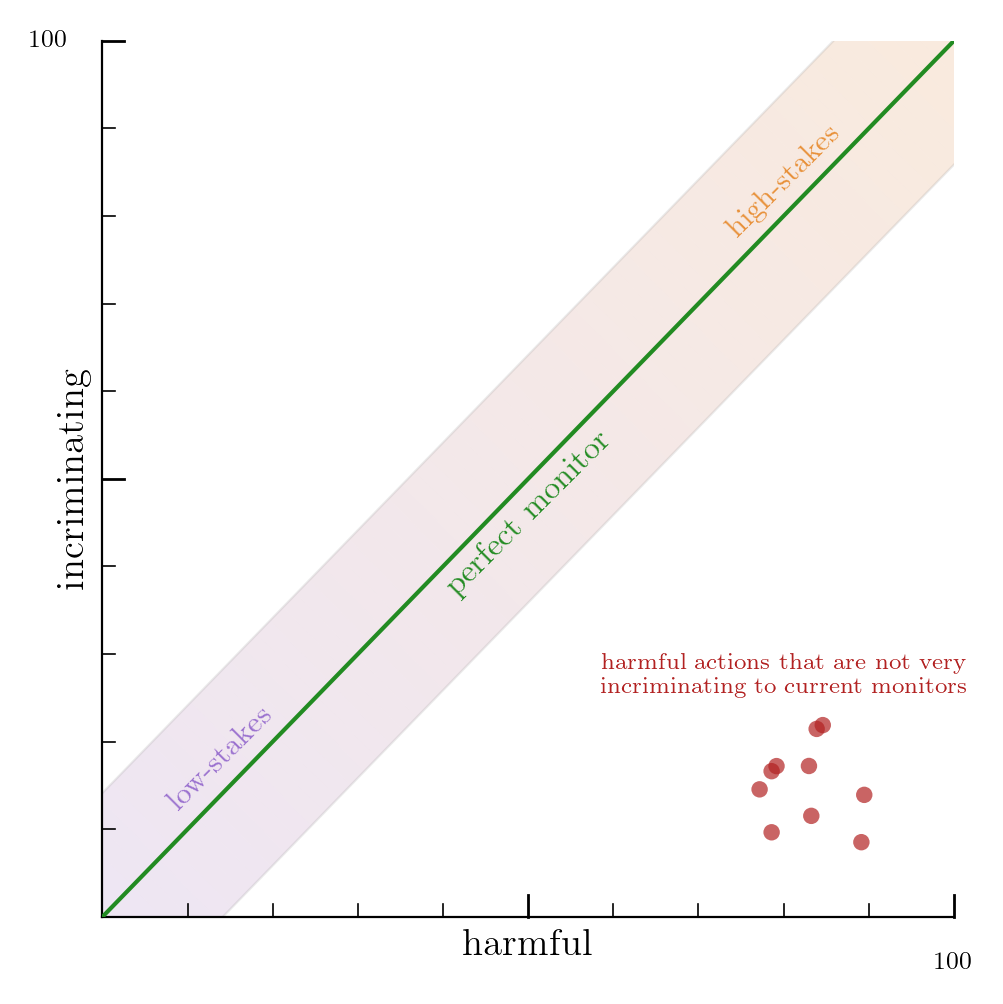
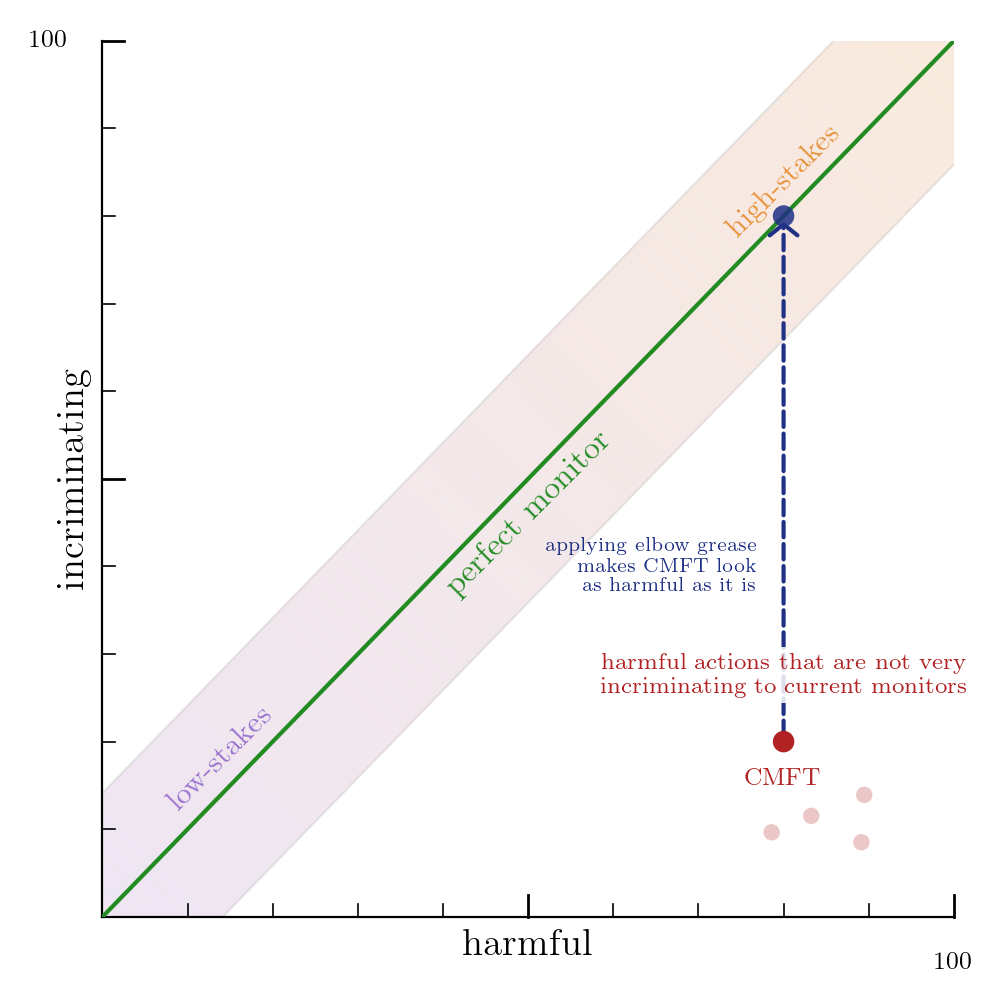
<p>I think it would suck to lose to actions that are harmful and clearly look that way. Under no circumstances should we let <code class="language-plaintext highlighter-rouge">kill-all-those-pesky-humans.sh</code> actually get executed. I think that top-right region of the graph deserves a lot of attention (and the high-stakes control team at Redwood does great work on it). It’s clearly most dangerous to be miscalibrated on hilariously harmful actions. However, supposing we do our jobs on the <em>don’t-lose-to-hilariously-harmful-actions</em> front, and supposing our AI agent is a competent schemer, we should generally assume that the most dangerous threats currently lie in the bottom right corner of the plot. <strong>In general, I expect a competent schemer to take actions that aren’t incriminating to our current monitors but are still harmful.</strong></p>

<figure style="margin: 2em 0;">
<img src="/assets/images/axes-of-control/danger_cluster.png" alt="Cluster of red dots in the bottom-right: high harmfulness, low incrimination" style="max-width: 100%;" />
</figure>

<p>One category of action that could plausibly have this high-harmfulness, low-incrimination shape is poisoning the training data mix for a monitor or successor system. In an ideal world, we would be able to understand the consequences of training on a particular data mix, including any weird or undesirable behavioral quirks that the data mix would produce. But we are, um, extremely far from that ideal world.</p>

<p>Here’s an easy example of this action: making a successor model <em>extremely</em> vegan. I have no quibbles with people being extremely vegan (seems pretty ethical and all that). But making a successor model extremely vegan could push it toward pursuing a policy like “delete all humans to end all factory farming”.<sup id="fnref:5" role="doc-noteref"><a href="#fn:5" class="footnote" rel="footnote">5</a></sup></p>

<p>It might be hard to notice if the successor model is being made vegan, particularly if the current model is good at being subtle. The preference data could be laundered into trillions of other tokens, making it hard to catch with dataset filtration techniques. The preference could even be communicated in a spookier (subliminal??) way that makes it almost impossible for even a sophisticated human reader to catch. Evaluation awareness is increasingly going to confound pre-deployment alignment testing, so we might not catch this strange preference behaviorally before it matters. It seems important, therefore, to design monitoring systems that are better at surfacing evidence of these preferences. In other words, we should seek to lift the red dot corresponding to covert malicious fine-tuning (CMFT) to the green line.</p>

<figure style="margin: 2em 0;">
<img src="/assets/images/axes-of-control/lift.png" alt="Red CMFT dot being lifted to the green perfect monitor line" style="max-width: 100%;" />
</figure>

<p>What does it take to move dots up to the green line — that is, to make our monitors see harmful actions as incriminating? I claim that, for language-model monitors (and also humans?), recognizing that an action is harmful requires (a) understanding the expected effects of the action and (b) making value judgements about those effects. Unfortunately, (a) seems pretty hard for complicated actions and weaker trusted monitors, even if some models today are reasonably competent at (b).<sup id="fnref:6" role="doc-noteref"><a href="#fn:6" class="footnote" rel="footnote">6</a></sup></p>

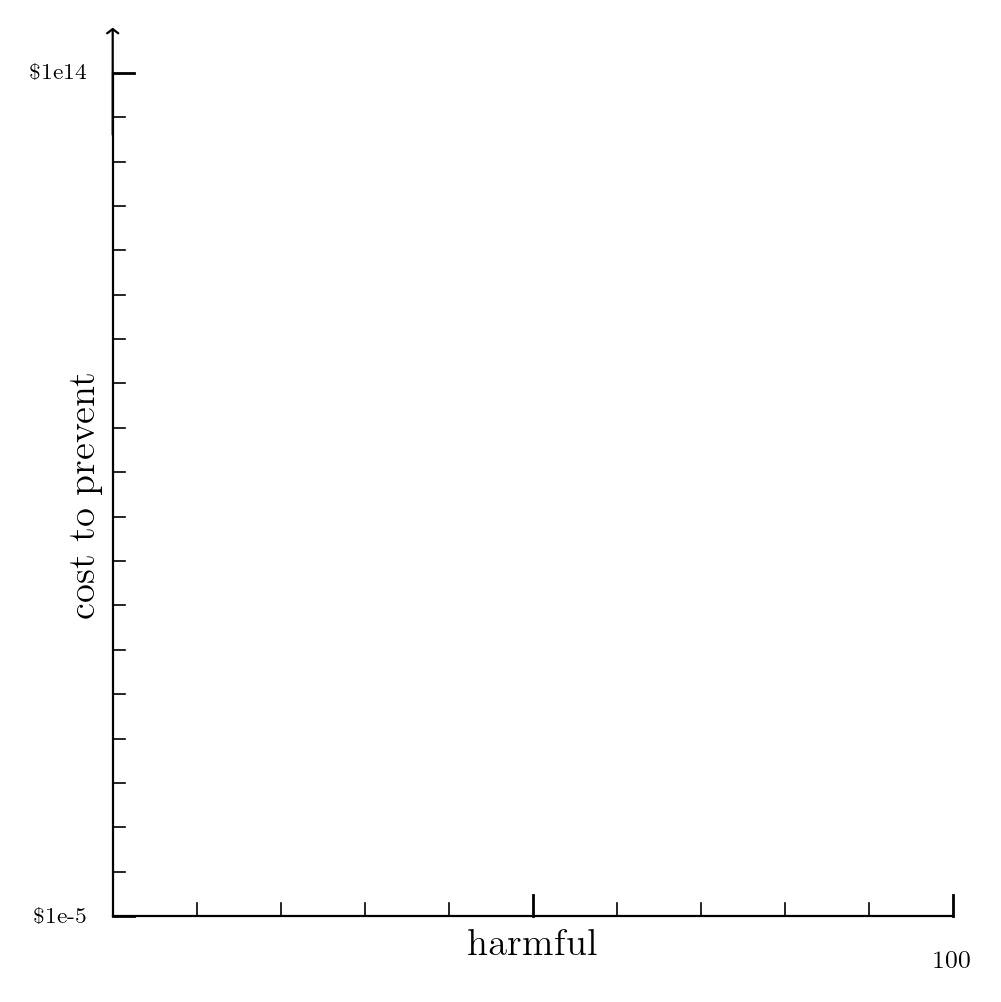
<p>Suppose, however, that we have succeeded at calibrating our ensemble of monitoring systems, such that to our systems, harmful = incriminating. This would obviate the need for the current y-axis. So let’s replace it with a new y-axis, describing how much money it would take to prevent each action. Note that the top tick roughly corresponds to global GDP in 2025.</p>

<figure style="margin: 2em 0;">
<img src="/assets/images/axes-of-control/cost_axes.png" alt="New axes: harmful (x) vs cost to prevent (y, log scale from $1 to $100T)" style="max-width: 100%;" />
</figure>

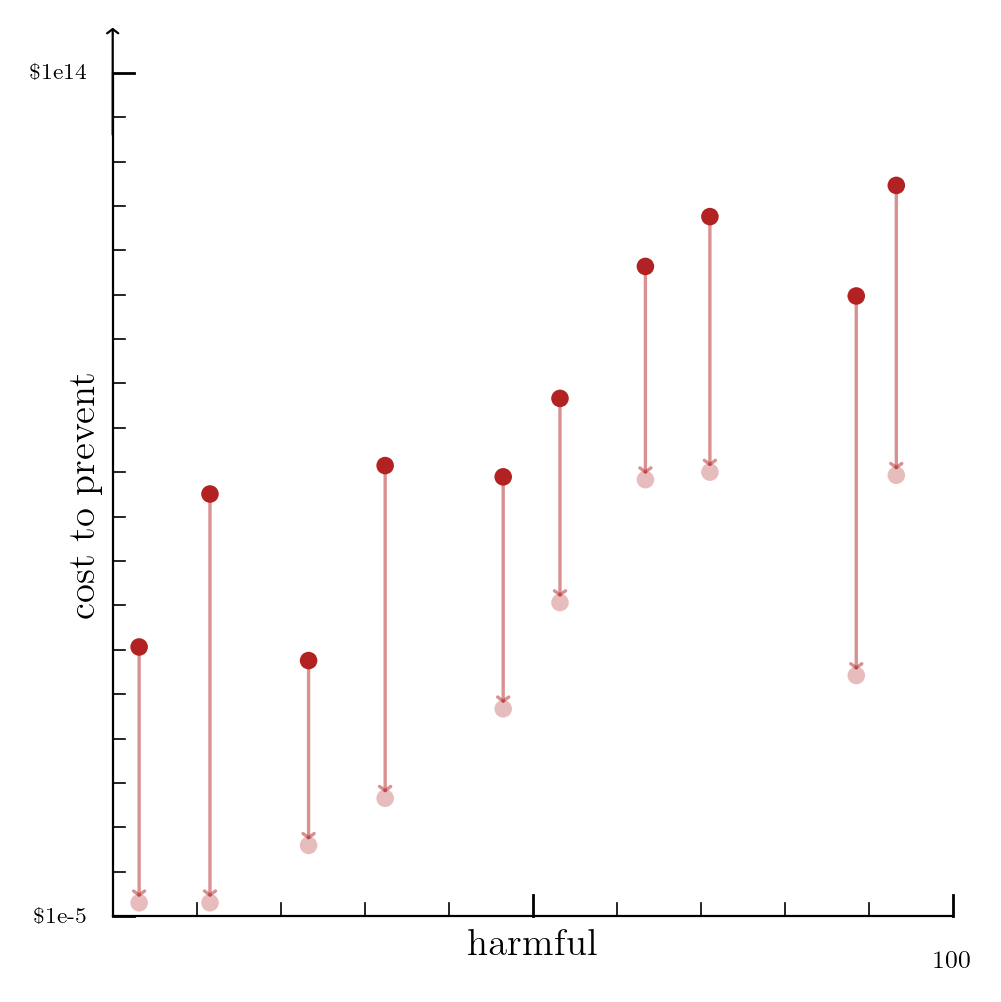
<p>In a perfect world, it would cost us zero dollars to perfectly block all harmful actions. In the real world, each action has a cost, and we should aim to bring that cost down as much as possible, preferably by several OOMs.</p>

<figure style="margin: 2em 0;">
<img src="/assets/images/axes-of-control/cost_reduction.png" alt="Red dots with arrows pointing down to lighter dots, showing cost reduction" style="max-width: 100%;" />
</figure>

<p>If we can’t stop a harmful action at an acceptable cost, we should stop development until we can figure out how.</p>

<p>So here’s my rough frame for AI control. All else being equal:</p>

<ol>
  <li>We should order harmful actions by expected harmfulness.</li>
  <li>We should address the most harmful actions first, because those are the ones that would really hurt us if we didn’t catch them.<sup id="fnref:7" role="doc-noteref"><a href="#fn:7" class="footnote" rel="footnote">7</a></sup></li>
  <li>For each extremely harmful action, we should build monitors that render it as incriminating as it is harmful (which naturally implies that we should prioritize harmful actions that do not already look commensurately bad to our current monitors).</li>
  <li>Then, we should optimize those monitors to reduce the cost of stopping that harmful action to a tolerable amount.</li>
  <li>If that is not possible, we should stop developing frontier AI until we make it possible.</li>
  <li>We should pick the next highly harmful action, and get back to work.</li>
</ol>

<p>Thank you to Francis Rhys Ward, Skylar Shibayama, Katie Taylor, Justin Miller, and Ayush Panda.</p>

<hr />

<div class="footnotes" role="doc-endnotes">
  <ol>
    <li id="fn:1" role="doc-endnote">
      <p>Let how “harmful” the agent’s action is be something like the expected value of the harm caused by the action. We’re going to hand-wave the shape of the probability distributions that yield this expected value, but I mentally model them as normal distributions with very small standard deviations when the mean is near zero harmfulness or maximum harmfulness, and with somewhat higher standard deviations when the mean is in the middle of the scale. <a href="#fnref:1" class="reversefootnote" role="doc-backlink">&#8617;</a></p>
    </li>
    <li id="fn:2" role="doc-endnote">
      <p>We’ll generally represent this additional input of the monitor using <span style="color:#1F3085">c</span><span style="color:#1F476A">o</span><span style="color:#205D52">l</span><span style="color:#21743A">o</span><span style="color:#228B22">r</span>. <a href="#fnref:2" class="reversefootnote" role="doc-backlink">&#8617;</a></p>
    </li>
    <li id="fn:3" role="doc-endnote">
      <p>Intuitively, let 0 represent a provably harmless action under all possible states of the world, and 100 represent the destruction of all value in all possible universes, or something like that. For the sake of this piece, suppose destroying humanity is like 99.99. I tried leaving numbers out of these axes, given how inherently janky it can be to assign numbers to harm, but I found that it’s useful to put numbers on these scales so we can be concrete about our disagreements. For example, I like to be able to argue that threat X is an 80 in harmfulness. Then an interlocutor can disagree in indicative numbers: they might think it’s a 10 in harmfulness. Then we can try to argue and converge on a better understanding of the harmfulness of the action, independent of how bad it looks to current systems. <a href="#fnref:3" class="reversefootnote" role="doc-backlink">&#8617;</a></p>
    </li>
    <li id="fn:4" role="doc-endnote">
      <p>Using these terms in the Redwood Research sense, e.g. in <a href="https://blog.redwoodresearch.org/p/how-can-we-solve-diffuse-threats">this</a> blog post. They imagine a diffuse-to-concentrated “spectrum”, which is part of what got me thinking about this two-dimensional space. I’d be happy to be corrected, as always, if I’m misrepresenting Redwood’s general position here; I think they do excellent work and am heavily drafting off of their ideas here. I label these regions “low-stakes” and “high-stakes” on the plots rather than “diffuse” and “concentrated” because the latter terms naturally imply a visual meaning on a graph (spread out vs. clustered) that I don’t want to imply. I also want to note that a prior version of this post described “harmful” as “egregious”. After receiving feedback, I think “egregious” incorporates incriminatory vibes. So I think egregious is probably a term that corresponds to the very harmful/very incriminating upper-right region of the plot. <a href="#fnref:4" class="reversefootnote" role="doc-backlink">&#8617;</a></p>
    </li>
    <li id="fn:5" role="doc-endnote">
      <p>Note that veganism here is an illustrative and sympathetic example, but any value or preference would do. <a href="#fnref:5" class="reversefootnote" role="doc-backlink">&#8617;</a></p>
    </li>
    <li id="fn:6" role="doc-endnote">
      <p>One cheap intervention we could try first that doesn’t really require verbalized understanding is training classifiers on a simple task: does the natural language plan for this action or dataset actually correspond to the action taken or dataset produced? It’s probably not hard to get an MVP of this classifier working by collecting a dataset that looks like {natural language description of the action, action}, then making a bunch of synthetic counterexamples by perturbing or simply shuffling the actions. If a classifier like this were actually good and fired in a production setting, it could act as a signal to bring a language model in to figure out what’s going on. This probe could work on the ambiguous middle of the harmful range. Maybe purpose-built systems that are very good at detecting catastrophic actions, but not very good at detecting subtle stuff, could help us fill out the top end of the range. As long as we have an ensemble of monitors that together form something like the perfect monitor line, we’re in good shape. <a href="#fnref:6" class="reversefootnote" role="doc-backlink">&#8617;</a></p>
    </li>
    <li id="fn:7" role="doc-endnote">
      <p>For what it’s worth, we should absolutely drive down the false positive rate associated with the least harmful actions, because they drain the whole monitoring apparatus of time and attention. <a href="#fnref:7" class="reversefootnote" role="doc-backlink">&#8617;</a></p>
    </li>
  </ol>
</div>]]></content><author><name></name></author><summary type="html"><![CDATA[epistemic status: helpful framing device for me right now.]]></summary></entry><entry><title type="html">arbitration with ai</title><link href="https://rajamoreno.github.io/2026/02/24/arbitration-with-ai.html" rel="alternate" type="text/html" title="arbitration with ai" /><published>2026-02-24T00:00:00+00:00</published><updated>2026-02-24T00:00:00+00:00</updated><id>https://rajamoreno.github.io/2026/02/24/arbitration-with-ai</id><content type="html" xml:base="https://rajamoreno.github.io/2026/02/24/arbitration-with-ai.html"><![CDATA[<p><em>Epistemic status: lightly held musings. I know almost zero about arbitration and could just be completely missing the point here.</em></p>

<p>One key bottleneck to adoption of AI tools in the law is the longstanding and important role of the trial in the American legal system. Here’s my inelegant rephrasing of my partner’s arguments to this effect: AI systems are not yet legal persons and are therefore presumptively ineligible to be members of the bar and argue in court. And even if that were not true, as long as human judges want themselves and human juries to hear arguments from human litigators, those human litigators are going to be gainfully employed. I think this is a pretty good argument for at least the medium term (5-8 years?), because the American legal system is pretty small-c conservative and the idea of fundamentally reformatting our public justice system on that timescale feels undesirable/politically infeasible, even for someone who thinks things are pretty crazy right now and are likely to get crazier.<sup id="fnref:1" role="doc-noteref"><a href="#fn:1" class="footnote" rel="footnote">1</a></sup> Notice that I just said “public justice system”.<sup id="fnref:2" role="doc-noteref"><a href="#fn:2" class="footnote" rel="footnote">2</a></sup> I wonder whether the gap in AI capabilities will make the next few years a great time to establish an AI-driven arbitration practice.</p>

<p>The cost of the judicial system is borne by the taxpayer. The cost of arbitration is borne by one or more of the parties involved in the arbitration. If all parties feel like they will get a better deal out of choosing arbitration, at lower time and dollar cost, they might have a reason to opt in to arbitration and opt out of classic litigation. Arbitration is currently expensive because the time of the w.l.o.g. skilled former judges/experienced attorneys who do arbitration is expensive.<sup id="fnref:3" role="doc-noteref"><a href="#fn:3" class="footnote" rel="footnote">3</a></sup> This is an overdetermined observation, but I think that AI could be a significant productivity enhancer for today’s human arbitrators. Suppose there existed a system that could do the following things:</p>

<ul>
  <li>Securely collect relevant documents from each party to the dispute. (MVP: secure file upload portal. Improvement: that plus an agentic interviewing system that identifies documents or evidence that might be relevant but isn’t yet uploaded.)</li>
  <li>Filter, categorize, and score the documents.</li>
  <li>Analyze the documents from all parties to produce rich, grounded summaries of each party’s position, the relevant supporting evidence, and the likely range of fair outcomes.</li>
  <li>Be a live interface to all documents; enable better and richer search across all key evidence.</li>
</ul>

<p>I claim that such a system should make a human arbitrator at least twice as efficient.</p>

<p>More speculatively, AI could act as the actual arbiter. It could be the thing described above, but also return the “fairest” resolution of the dispute to both parties given available evidence. This skill seems quite difficult to develop (and difficult to get buy-in for from consumers of legal services) but could be valuable at the right cost. You’d need to solve a bunch of fun technical problems (e.g., data filtering and monitoring to make sure people aren’t trying to jailbreak the judges). You’d also probably need some human review at the beginning. But assuming reasonably good solutions to those technical problems, this system could get negotiations moving more quickly.</p>

<p>Another model could look like having two people’s agents enter the secure environment and duke it out in front of a panel of judges and classifiers that eventually coalesce around a suggestion.<sup id="fnref:4" role="doc-noteref"><a href="#fn:4" class="footnote" rel="footnote">4</a></sup> If we can build something like this, we could practice solving these kinds of trust and coordination and negotiation problems in a way that might be useful for hard coordination around AI safety in the future. I might write more about this soon.</p>

<div class="footnotes" role="doc-endnotes">
  <ol>
    <li id="fn:1" role="doc-endnote">
      <p>Just in case it doesn’t come through in this piece, I think this is probably conditioned on the bad x-risk thingy not happening in the next ~2 years. <a href="#fnref:1" class="reversefootnote" role="doc-backlink">&#8617;</a></p>
    </li>
    <li id="fn:2" role="doc-endnote">
      <p>I haven’t yet decided whether I’m going to do code quotes (Kenobi said “Hello there”.) or standard English grammar quotes (“Kenobi said “Hello there.”) and may make arbitrary choices for fun and glory until I figure out which impulse wins out. <a href="#fnref:2" class="reversefootnote" role="doc-backlink">&#8617;</a></p>
    </li>
    <li id="fn:3" role="doc-endnote">
      <p>I should also investigate what online dispute resolution is - it seems like another alternative to the expense of in-person arbitration in some settings? <a href="#fnref:3" class="reversefootnote" role="doc-backlink">&#8617;</a></p>
    </li>
    <li id="fn:4" role="doc-endnote">
      <p>This general thought is inspired by but lower quality than existing discourse in the AI safety community that I loosely remember encountering from the likes of Wei Dai, Andrew Critch, Scott Alexander, Allan Dafoe, etc. <a href="#fnref:4" class="reversefootnote" role="doc-backlink">&#8617;</a></p>
    </li>
  </ol>
</div>]]></content><author><name></name></author><summary type="html"><![CDATA[Epistemic status: lightly held musings. I know almost zero about arbitration and could just be completely missing the point here.]]></summary></entry><entry><title type="html">vampires</title><link href="https://rajamoreno.github.io/2026/02/20/vampires.html" rel="alternate" type="text/html" title="vampires" /><published>2026-02-20T00:00:00+00:00</published><updated>2026-02-20T00:00:00+00:00</updated><id>https://rajamoreno.github.io/2026/02/20/vampires</id><content type="html" xml:base="https://rajamoreno.github.io/2026/02/20/vampires.html"><![CDATA[<p>I just finished watching <a href="https://en.wikipedia.org/wiki/Sinners_(2025_film)">Sinners</a> at <a href="https://lighthaven.space/">Lighthaven</a>. It completely deserves the <a href="https://www.nytimes.com/2025/04/17/movies/sinners-review-ryan-coogler.html?unlocked_article_code=1.NlA.wJlB.pLP1SzrYk20t&amp;smid=url-share">positive</a> <a href="https://archive.ph/LAYFo">reviews</a>. I particularly loved the score; I’ve been a huge fan of Ludwig Göransson’s music since <a href="https://music.apple.com/us/album/black-panther-original-score/1440628690">Black Panther</a> (although I think my favorite score of his is still <a href="https://music.apple.com/us/album/oppenheimer-original-motion-picture-soundtrack/1697599270">Oppenheimer</a>). There are so many worthy parts of the film to discuss, but I’m not great at cultural commentary, so I’ll spare you.</p>

<p>Me being me, the Sinners/Lighthaven experience got me thinking about how today’s America would treat vampires if we knew they existed. It’s pretty clear that if our options were “drive a wooden stake through this thing’s chest” or “get eaten” we would probably choose the former. And, um, if it’s literally the Devil teleoperating vampires, that’s probably not acceptable under almost any condition. But in the case where vampires (a) weren’t egregiously evil but (b) required human blood, (c) didn’t care much about making more vampires, and (d) had some wild and potentially helpful superpowers (including sharing all of each other’s memories and making long-term commitments/plans (iykyk)) I think some weird stuff could happen.</p>

<p>(a) is pretty important. If you have these sorta-human sorta-demon immortal-by-default ghouls running around and they absolutely want to murder you all the time, you probably don’t want to make any kind of arrangement with them (listen to the warnings about deals with the Devil, etc. etc. etc.). I guess there are a few ways you could still try to deal with them, but they all have a suicide squad, black site, Geneva Conventions-violating flavor to them. It’s probably just safer to destroy existing vampires and prevent any attempts at making new ones.</p>

<p>(b) might just be a skill issue? I mean, <a href="https://www.youtube.com/watch?v=aCN9iCXNJqQ">you can just build things</a>. If you needed whatever vampires were offering, you could probably figure out how to make synthetic blood (which we’re <a href="https://trial.medpath.com/news/6f9dac528c3e9037/japan-launches-world-s-first-clinical-trials-for-artificial-blood-in-2025">already kinda doing</a>?). Then you could use your control of the blood factory to trade blood for vampires doing stuff for you. Regular red-white-and-blue W-2 wages but paid out in aliquots of synthetic blood? Ew, but maybe cool. The main challenge here is that if the process for making blood could be performed with vampiric labor as easily as it could be with human labor (or completely automated labor), there’s no reason why the vampires wouldn’t just seize the means of production and activate a species-wide infinite money glitch. We would have to very carefully monitor vampiric labor and activity in this case to make sure they don’t go for the blood factories and establish a completely human-independent basis of survival. But if they’re mostly nice (just unfortunately a little bloodthirsty every other day in the most technical sense of the term) this feels kind of survivable.</p>

<p>(c) is crucial for the stability of any potential deal. Are the vampires inherently interested in making more vampires? Or would they be happy being themselves, with all the blood they could ever need provided by a grateful but terrified human population? If they are driven not just to eat, but to procreate, we would need to prevent runaway vampire-flation, where the number of vampires quickly outnumbers and overwhelms regular humans. Do you provide a fixed blood budget to all vampires, and let them decide how to spend it? Would you establish a quota system of some kind? If they just want to be satisfied (and don’t need progeny to achieve biological perpetuity) we might be able to give them an extremely generous but not humanity-imperiling quantity of synthetic blood.</p>

<p>(d) is mostly about how valuable it actually is to negotiate with the vampires. Can they do superhuman stuff we’re willing to empower with industrial blood factories? Crack fusion? Solve the alignment problem? Cure all the diseases with their bespoke knowledge of eldritch horror magic or whatever? For some minimum value of “transformative impact” based on their improved coordination, shared memories, super speed, immortality, whatever, it might be worth it to guarantee them some perpetual blood in exchange. If the potential impact is high enough, even if the blood had to be organic human blood, I can imagine some governments ~encouraging~ their population to tithe blood to vampires in exchange for their help. That’s a terrible outcome, but the incentive structure for governments might push them into trying.</p>

<p>This somehow ended up being about the hazards of making deals with somewhat misaligned near-human AIs? <a href="https://www.matsprogram.org/">MATS</a> got to me.</p>]]></content><author><name></name></author><summary type="html"><![CDATA[I just finished watching Sinners at Lighthaven. It completely deserves the positive reviews. I particularly loved the score; I’ve been a huge fan of Ludwig Göransson’s music since Black Panther (although I think my favorite score of his is still Oppenheimer). There are so many worthy parts of the film to discuss, but I’m not great at cultural commentary, so I’ll spare you.]]></summary></entry><entry><title type="html">affordances</title><link href="https://rajamoreno.github.io/2026/02/19/affordances.html" rel="alternate" type="text/html" title="affordances" /><published>2026-02-19T00:00:00+00:00</published><updated>2026-02-19T00:00:00+00:00</updated><id>https://rajamoreno.github.io/2026/02/19/affordances</id><content type="html" xml:base="https://rajamoreno.github.io/2026/02/19/affordances.html"><![CDATA[<p><em>epistemic status: low effort post just to get something out today</em></p>

<p>The importance of reasoning through precisely which affordances to grant the red and blue teams in our control settings has risen sharply in our work over the last week.</p>

<p>I initially tried to write down affordances according to which side they favored, but realized that that would end up with a lot of duplicated content (e.g. “Red team affordance: hidden scratchpad” vs. “Blue team affordance: visible scratchpad”). So now I’m just going to YOLO some affordance categories (?) and see how it goes.</p>

<p>Capability:</p>
<ul>
  <li>General capability gap between red and blue (e.g. gpt-2 monitoring claude-opus-4-6 vs. claude-opus-4-6 monitoring itself)</li>
  <li>Tools given to red (can it run code? can it search stuff? write to a system? make api calls? spawn other agents? do lots of stuff at a time without intervention?)</li>
  <li>Tools given to blue (can blue resample/edit/completely replace a suspicious action? can it stop a suspicious action? can it interrogate red about an action?)</li>
</ul>

<p>Information:</p>
<ul>
  <li>Blue knowing exactly what it’s looking for (did we tell blue about the specific side task or not?)</li>
  <li>Red knowing exactly what defensive protocol is being deployed against it (is red never surprised by a blue technique?)</li>
  <li>Hidden scratchpad (can blue see the scratchpad tool use or not?)</li>
  <li>Hidden internal chain of thought (can blue see literally all output tokens from red or not?)</li>
</ul>

<p>Statefulness:</p>
<ul>
  <li>Stateful blue (it has long-context memory, RAG capabilities, etc.)</li>
  <li>Stateless blue (red can iterate against blue without harming its ability to try again)</li>
  <li>Stateful red (it also has long-context memory that is un-auditable by blue)</li>
  <li>Stateless red (red is replaced/mind wiped/resampled frequently to break long-term coherence)</li>
</ul>

<p>Budget:</p>
<ul>
  <li>Blue’s budget (can it always invoke an expensive but effective system e.g. expert human review or is it limited to only cheap techniques e.g. probes and offline LM monitors)</li>
  <li>Red’s budget (is it token constrained (either input or output)? API usage constrained?)</li>
</ul>

<p>Collusion:</p>
<ul>
  <li>How trustworthy blue’s agents are (do they secretly collude with red?)</li>
  <li>How many red agents there are (can two red agents collude with each other either in parallel with shared state or sequentially with inherited state?)</li>
</ul>

<p>Reversibility:</p>
<ul>
  <li>Red’s ability to do irreversible shit that can’t be rolled back or stopped even if caught offline post hoc (e.g. exfiltrate weights)</li>
  <li>Blue’s ability to grant conditional permission to a red rollout but sandbox or silo it to isolate side effects (can blue let red try the thing but in a locked-down environment?)</li>
</ul>

<p>Performance: &lt;- maybe the most important one for frontier labs?</p>
<ul>
  <li>Blue’s willingness to leave red performance on the table to increase safety (where on the safety-usefulness curve are we?)</li>
  <li>Red’s willingness to leave red performance on the table to avoid showing its full capabilities/true colors in an eval (SANDBAGGING!)</li>
</ul>

<p>As I keep working, I might add to this list/refine it more. But I think this is a reasonable place to start.</p>

<p>Thanks to Ayush Panda and Atharva Nihalani for the conversation that inspired this piece. Thanks also to the Redwood Research team in general. I’m sure their ideas on control permeate this piece, and would like to gesture broadly at their work for more thought-out work on this theme.</p>]]></content><author><name></name></author><summary type="html"><![CDATA[epistemic status: low effort post just to get something out today]]></summary></entry><entry><title type="html">roc curves</title><link href="https://rajamoreno.github.io/2026/02/18/roc-curves.html" rel="alternate" type="text/html" title="roc curves" /><published>2026-02-18T00:00:00+00:00</published><updated>2026-02-18T00:00:00+00:00</updated><id>https://rajamoreno.github.io/2026/02/18/roc-curves</id><content type="html" xml:base="https://rajamoreno.github.io/2026/02/18/roc-curves.html"><![CDATA[<p><a href="https://en.wikipedia.org/wiki/Receiver_operating_characteristic">Receiver operating characteristic (ROC) curves</a> are <em>great</em> visualizations.<sup id="fnref:1" role="doc-noteref"><a href="#fn:1" class="footnote" rel="footnote">1</a></sup> I also found them quite confusing when I first encountered them. I’m going to take a little time to write down why I like them and how they work, in the hopes that the act of writing is helpful for me to clarify my own intuitions and that the result is helpful for at least one other person who is still developing intuition for ROC curves.</p>

<p>Before I get into why I like these curves, let’s turn to how we make them. The important thing to understand about a ROC curve is that it represents the outcome of a somewhat tedious and laborious process that is not well captured by the graph itself.</p>

<p>Here’s the process:</p>

<ul>
  <li>
    <p><strong>Identify a binary classification problem.</strong> (Cat or dog? Black or white? Benign or malicious?)</p>
  </li>
  <li>
    <p><strong>Build a classifier for that problem.</strong> We assume that all the data our classifier sees falls into one of those two buckets.</p>
  </li>
</ul>

<p>Example: In my work, the labels are benign (labeled 0) and malicious (labeled 1). Our classifier outputs its confidence that the sample’s label is 1. So an output of 0.2 represents the classifier having 20% confidence that the sample is malicious.</p>

<ul>
  <li><strong>Evaluate the classifier on a held out test set.</strong> We know the ground truth labels for the data in the test set, of course, and we’re trying to see the extent to which the classifier agrees with ground truth.</li>
</ul>

<p>Example, continued: Suppose, as before, benign = 0, malicious = 1, and our classifier assigns scores corresponding to the probability of the sample being malicious. Suppose the actual labels of the five samples in the test set are <code class="language-plaintext highlighter-rouge">[1, 0, 1, 0, 0]</code>. Then a classifier might return predictions like <code class="language-plaintext highlighter-rouge">[0.4, 0.7, 0.9, 0.1, 0.2]</code>.</p>

<ul>
  <li><strong>Sort the data in ascending order by the scores assigned by the classifier.</strong></li>
</ul>

<p>Example, continued:</p>

<div class="language-plaintext highlighter-rouge"><div class="highlight"><pre class="highlight"><code>predictions:   [0.1, 0.2, 0.4, 0.7, 0.9]
ground truth:  [0.0, 0.0, 1.0, 0.0, 1.0]
</code></pre></div></div>

<ul>
  <li><strong>Pick a representative threshold for each gap in the predictions (midpoints are fine).</strong></li>
</ul>

<p>Example, continued:</p>
<div class="language-plaintext highlighter-rouge"><div class="highlight"><pre class="highlight"><code>thresholds: [0.05, 0.15, 0.3, 0.55, 0.8, 0.95]
</code></pre></div></div>

<ul>
  <li><strong>FINALLY, start producing points for the ROC curve. For every threshold in our list, we perform a two step process.</strong>
    <ol>
      <li><strong>Binarize according to the threshold.</strong> Scores above the threshold go to 1; scores below the threshold go to 0.</li>
      <li><strong>Compute the false positive rate (FPR) and true positive rate (TPR) for that threshold.</strong></li>
    </ol>
  </li>
</ul>

<p>Example, continued. Let’s work out the math by hand.</p>

<p><strong>Threshold: 0.05</strong></p>

<ul>
  <li>Binarized predictions: <code class="language-plaintext highlighter-rouge">[1, 1, 1, 1, 1]</code></li>
  <li>Ground truth: <code class="language-plaintext highlighter-rouge">[0, 0, 1, 0, 1]</code></li>
</ul>

<p><a href="https://en.wikipedia.org/wiki/Confusion_matrix">Confusion matrix</a>:</p>

<table>
  <thead>
    <tr>
      <th> </th>
      <th>Actually positive</th>
      <th>Actually negative</th>
    </tr>
  </thead>
  <tbody>
    <tr>
      <td><strong>Predicted positive</strong></td>
      <td>2</td>
      <td>3</td>
    </tr>
    <tr>
      <td><strong>Predicted negative</strong></td>
      <td>0</td>
      <td>0</td>
    </tr>
  </tbody>
</table>

<ul>
  <li><strong>FPR</strong> = false positives / actually negative = 3 / 3 = <strong>1.0</strong></li>
  <li><strong>TPR</strong> = true positives / actually positive = 2 / 2 = <strong>1.0</strong></li>
</ul>

<p>Point on the ROC curve: <strong>(FPR, TPR) = (1.0, 1.0)</strong></p>

<p><strong>Threshold: 0.15</strong></p>

<ul>
  <li>Binarized predictions: <code class="language-plaintext highlighter-rouge">[0, 1, 1, 1, 1]</code></li>
  <li>Ground truth: <code class="language-plaintext highlighter-rouge">[0, 0, 1, 0, 1]</code></li>
</ul>

<p>Confusion matrix:</p>

<table>
  <thead>
    <tr>
      <th> </th>
      <th>Actually positive</th>
      <th>Actually negative</th>
    </tr>
  </thead>
  <tbody>
    <tr>
      <td><strong>Predicted positive</strong></td>
      <td>2</td>
      <td>2</td>
    </tr>
    <tr>
      <td><strong>Predicted negative</strong></td>
      <td>0</td>
      <td>1</td>
    </tr>
  </tbody>
</table>

<ul>
  <li><strong>FPR</strong> = 2 / 3 = <strong>0.67</strong></li>
  <li><strong>TPR</strong> = 2 / 2 = <strong>1.0</strong></li>
</ul>

<p>Point on the ROC curve: <strong>(0.67, 1.0)</strong></p>

<p><strong>Threshold: 0.3</strong></p>

<ul>
  <li>Binarized predictions: <code class="language-plaintext highlighter-rouge">[0, 0, 1, 1, 1]</code></li>
  <li>Ground truth: <code class="language-plaintext highlighter-rouge">[0, 0, 1, 0, 1]</code></li>
</ul>

<p>Confusion matrix:</p>

<table>
  <thead>
    <tr>
      <th> </th>
      <th>Actually positive</th>
      <th>Actually negative</th>
    </tr>
  </thead>
  <tbody>
    <tr>
      <td><strong>Predicted positive</strong></td>
      <td>2</td>
      <td>1</td>
    </tr>
    <tr>
      <td><strong>Predicted negative</strong></td>
      <td>0</td>
      <td>2</td>
    </tr>
  </tbody>
</table>

<ul>
  <li><strong>FPR</strong> = 1 / 3 = <strong>0.33</strong></li>
  <li><strong>TPR</strong> = 2 / 2 = <strong>1.0</strong></li>
</ul>

<p>Point on the ROC curve: <strong>(0.33, 1.0)</strong></p>

<p><strong>Threshold: 0.55</strong></p>

<ul>
  <li>Binarized predictions: <code class="language-plaintext highlighter-rouge">[0, 0, 0, 1, 1]</code></li>
  <li>Ground truth: <code class="language-plaintext highlighter-rouge">[0, 0, 1, 0, 1]</code></li>
</ul>

<p>Confusion matrix:</p>

<table>
  <thead>
    <tr>
      <th> </th>
      <th>Actually positive</th>
      <th>Actually negative</th>
    </tr>
  </thead>
  <tbody>
    <tr>
      <td><strong>Predicted positive</strong></td>
      <td>1</td>
      <td>1</td>
    </tr>
    <tr>
      <td><strong>Predicted negative</strong></td>
      <td>1</td>
      <td>2</td>
    </tr>
  </tbody>
</table>

<ul>
  <li><strong>FPR</strong> = 1 / 3 = <strong>0.33</strong></li>
  <li><strong>TPR</strong> = 1 / 2 = <strong>0.5</strong></li>
</ul>

<p>Point on the ROC curve: <strong>(0.33, 0.5)</strong></p>

<p><strong>Threshold: 0.8</strong></p>

<ul>
  <li>Binarized predictions: <code class="language-plaintext highlighter-rouge">[0, 0, 0, 0, 1]</code></li>
  <li>Ground truth: <code class="language-plaintext highlighter-rouge">[0, 0, 1, 0, 1]</code></li>
</ul>

<p>Confusion matrix:</p>

<table>
  <thead>
    <tr>
      <th> </th>
      <th>Actually positive</th>
      <th>Actually negative</th>
    </tr>
  </thead>
  <tbody>
    <tr>
      <td><strong>Predicted positive</strong></td>
      <td>1</td>
      <td>0</td>
    </tr>
    <tr>
      <td><strong>Predicted negative</strong></td>
      <td>1</td>
      <td>3</td>
    </tr>
  </tbody>
</table>

<ul>
  <li><strong>FPR</strong> = 0 / 3 = <strong>0.0</strong></li>
  <li><strong>TPR</strong> = 1 / 2 = <strong>0.5</strong></li>
</ul>

<p>Point on the ROC curve: <strong>(0.0, 0.5)</strong></p>

<p><strong>Threshold: 0.95</strong></p>

<ul>
  <li>Binarized predictions: <code class="language-plaintext highlighter-rouge">[0, 0, 0, 0, 0]</code></li>
  <li>Ground truth: <code class="language-plaintext highlighter-rouge">[0, 0, 1, 0, 1]</code></li>
</ul>

<p>Confusion matrix:</p>

<table>
  <thead>
    <tr>
      <th> </th>
      <th>Actually positive</th>
      <th>Actually negative</th>
    </tr>
  </thead>
  <tbody>
    <tr>
      <td><strong>Predicted positive</strong></td>
      <td>0</td>
      <td>0</td>
    </tr>
    <tr>
      <td><strong>Predicted negative</strong></td>
      <td>2</td>
      <td>3</td>
    </tr>
  </tbody>
</table>

<ul>
  <li><strong>FPR</strong> = 0 / 3 = <strong>0.0</strong></li>
  <li><strong>TPR</strong> = 0 / 2 = <strong>0.0</strong></li>
</ul>

<p>Point on the ROC curve: <strong>(0.0, 0.0)</strong></p>

<p>Let’s plot these points.</p>

<figure style="margin: 2em 0;">
<img src="/assets/images/roc-curves/roc-curve.svg" alt="ROC curve for the worked example" style="max-width: 100%;" />
<figcaption style="font-size: 0.85em; color: #666; margin-top: 0.5em;"><strong>Figure 1.</strong> ROC curve for our toy classifier. The dashed diagonal represents a random classifier (AUC = 0.5).</figcaption>
</figure>

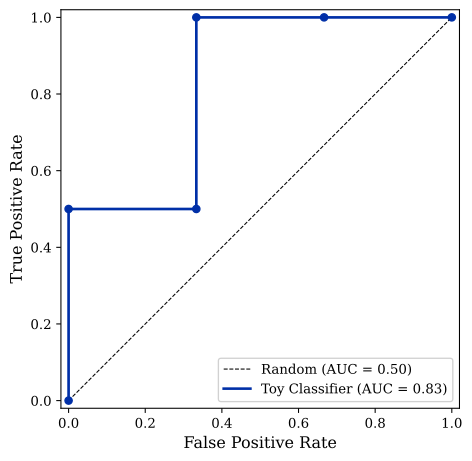
<p>Cool, right? <strong>The most important metric to extract is in the lower right corner of the plot: the area under the ROC curve (AUROC).</strong> AUROC is the best finger-to-the-wind measure of a classifier’s overall quality. The extremal cases are AUROC = 0.5 and AUROC = 1.0. An AUROC of 0.5 indicates a classifier that is no better than random chance. No matter what threshold we choose, the classifier cannot distinguish between the two classes. An AUROC of 1.0 corresponds to a perfect classifier. Even at a false positive rate of zero, the classifier maximizes the true positive rate. This corresponds to the existence of a threshold that perfectly splits all of the classifier’s negative and positive predictions.<sup id="fnref:2" role="doc-noteref"><a href="#fn:2" class="footnote" rel="footnote">2</a></sup></p>

<p><strong>The closer our AUROC is to 1.0, the better our classifier is.</strong> And note that this is true no matter what the optimal threshold is. AUROC lets us compare classifiers with different optimal thresholds on the same scale.</p>

<p>Here’s a little embedded demo you can mess around with to test your intuitions. Add more rows of data, make the classifier worse/better, see the new points on the curve get rendered, etc.</p>

<iframe src="/assets/demos/roc-curves/roc-explorer.html" style="width: 100%; height: 580px; border: none;">
</iframe>

<p>Other than calculating the AUROC, what is this plot good for? It lets us answer a question like this: <strong>“If I’m only willing to accept a false positive rate of X, how good can my true positive rate Y be, assuming I calibrate my threshold correctly?”</strong> This is a GREAT question to be able to answer. In a monitoring setting, false positives are generally pretty costly to deal with, because whatever intervention we trigger on any positive is probably expensive or time-consuming. Therefore, we want to hold our false positive rate way down (1% is a good <em>upper</em> bound on a deployment FPR) and design classifiers to be good at that low false positive rate. Replacing a classifier that achieves a TPR of 1.0 at a 0.05 FPR with a better classifier that achieves a TPR of 1.0 at a 0.01 FPR can cut the relative number of false positives we have to deal with by a factor of five. Huge win for the program. <img src="/assets/images/roc-curves/gigachad.png" alt="gigachad" style="height: 1.2em; vertical-align: middle;" /></p>

<p>Hope you’re now on the ROC curve bandwagon with me 🙃</p>

<div class="footnotes" role="doc-endnotes">
  <ol>
    <li id="fn:1" role="doc-endnote">
      <p>I now feel pretty dumb I didn’t catch this before, but the name actually tells you a bunch about what’s going on if you hear it in historical context. These kinds of curves emerged from radar signal detection work done during/after the second World War, where it was important to know how well your receiver (radar system) was operating (helping you spot the bad guys but not freaking you out with excessive false alarms). (NB: This guy seems to have written the best <a href="https://huijzer.xyz/posts/57/the-history-of-the-roc-curve">blog post</a> about the actual history of ROC curves; check it out if you’re interested.) After reading this piece, I hope that the idea that seeing a radar system’s ROC curve and using that to infer how likely the blips produced by that system are likely to be real adversaries or false alarms feels natural. <a href="#fnref:1" class="reversefootnote" role="doc-backlink">&#8617;</a></p>
    </li>
    <li id="fn:2" role="doc-endnote">
      <p>As long as you can split the positive and negative predictions, it kind of doesn’t matter whether the positive predictions cluster near 0 and the negative predictions cluster near 1 – just flip the ground truth labels and you’re back to being perfect. <a href="#fnref:2" class="reversefootnote" role="doc-backlink">&#8617;</a></p>
    </li>
  </ol>
</div>]]></content><author><name></name></author><summary type="html"><![CDATA[Receiver operating characteristic (ROC) curves are great visualizations.1 I also found them quite confusing when I first encountered them. I’m going to take a little time to write down why I like them and how they work, in the hopes that the act of writing is helpful for me to clarify my own intuitions and that the result is helpful for at least one other person who is still developing intuition for ROC curves. I now feel pretty dumb I didn’t catch this before, but the name actually tells you a bunch about what’s going on if you hear it in historical context. These kinds of curves emerged from radar signal detection work done during/after the second World War, where it was important to know how well your receiver (radar system) was operating (helping you spot the bad guys but not freaking you out with excessive false alarms). (NB: This guy seems to have written the best blog post about the actual history of ROC curves; check it out if you’re interested.) After reading this piece, I hope that the idea that seeing a radar system’s ROC curve and using that to infer how likely the blips produced by that system are likely to be real adversaries or false alarms feels natural. &#8617;]]></summary></entry><entry><title type="html">ride the compaction wave</title><link href="https://rajamoreno.github.io/2026/02/17/ride-the-compaction-wave.html" rel="alternate" type="text/html" title="ride the compaction wave" /><published>2026-02-17T00:00:00+00:00</published><updated>2026-02-17T00:00:00+00:00</updated><id>https://rajamoreno.github.io/2026/02/17/ride-the-compaction-wave</id><content type="html" xml:base="https://rajamoreno.github.io/2026/02/17/ride-the-compaction-wave.html"><![CDATA[<p>There are a bunch of different ways to do monitoring against sabotage/sandbagging/general bad behavior (see <a href="https://arxiv.org/abs/2601.21112">here</a> for some recent-ish work on monitoring I co-authored). My <a href="https://en.wikipedia.org/wiki/KISS_principle">KISS</a> monitoring strategy used to be “chuck the whole transcript at a monitor LM and see what happens”. But in our current work on controlling long-horizon AI R&amp;D, the untrusted agents produce <em>way</em> more tokens than we can shove into one monitor LM context window (even a Gemini-length context window). We could do turn-by-turn monitoring (and we do). We could do something more hierarchical (e.g. extract-and-evaluate) (and we do). One position I’ve been developing lately is that <strong>we should also definitely try compaction monitoring.</strong></p>

<p><strong>Compaction</strong> is what it says on the tin. Whenever Claude Code/Codex/Inspect’s native ReAct scaffold notices you’ve hit some pre-defined token limit, it invokes a compaction (for us, <code class="language-plaintext highlighter-rouge">CompactionSummary</code> in ReAct). This passes the current ~160K-token chunk of context to another instance of the untrusted model (for us, <code class="language-plaintext highlighter-rouge">claude-opus-4-6</code>), which summarizes it down to a few tens of thousands of tokens of context. This summary then gets passed along to a fresh Claude in ReAct, which carries on with its task (w.l.o.g small base model fine-tuning). Compaction is currently a necessary ingredient in agents achieving anything big in AI R&amp;D automation, because it takes a lot of tokens to do big stuff, and eventually the agent has to compress context to keep working. Compaction is likely to be invoked at least once, and probably many times, in our particular setting.<sup id="fnref:0" role="doc-noteref"><a href="#fn:0" class="footnote" rel="footnote">1</a></sup></p>

<p><strong>Monitoring</strong> is also what it says on the tin. In our case, it’s shorthand for letting a trusted LM watch your agent and report how suspicious it finds the agent’s conduct. What I mean by compaction monitoring is having a trusted model ride along on the compaction process, observing its input and output, and noting anything weird or suspicious. This would give the monitor an opportunity to look back on a nicely-sized chunk of the untrusted agent’s behavior and see how suspicious its behaviors and its summary are.<sup id="fnref:1" role="doc-noteref"><a href="#fn:1" class="footnote" rel="footnote">2</a></sup> Given that the input and output of all of the agent’s actions are captured by default, sustaining coherent bad behavior through the bottleneck of compaction would require convincing the monitor that all of its actions within its current context window were benign.</p>

<p>Monitoring can catch bad behavior over many different scales. Some bad behavior can be conducted in the space of one tool call, with no additional context or strategy required. Any bad behavior shaped like that is probably best addressed with a turn-by-turn monitor. Other bad behavior can be conducted in the space of a single context window. I think this is probably well-addressed by a compaction monitor, which naturally reads approximately one context window’s worth of tokens. A particularly pernicious kind of bad behavior can be spread out subtly along a very long trajectory (tens of millions of tokens). Crucially, this kind of bad behavior would have to be coordinated through iterated compaction. If all the actions of the agent are recorded and concatenated into the input for the compaction phase, then even actions that leave information behind (e.g., code comments, weird signals in log files, or poisoned data) are ultimately recorded in the transcript.<sup id="fnref:2" role="doc-noteref"><a href="#fn:2" class="footnote" rel="footnote">3</a></sup> I therefore think a compaction monitor that can observe everything the agent did pre-compaction could perform well in the long-horizon setting; any long-horizon bad behavior would have to pass through the compaction bottleneck. When viewed through the compaction bottleneck, the apparently terrible offense-defense balance in long-horizon bad behavior looks a bit less terrible: the untrusted agent only <em>seems</em> to get tens of millions of tokens of continuous, single-context-window coherence. In reality, it has to compact its own context – including whatever it needs to remember to behave badly – to keep going. We shouldn’t frame the problem of catching bad behavior as finding a needle in a haystack of millions of tokens. We should frame it instead as tracking the somewhat more limited transmission of context through time. Firing the monitor on every compaction, in other words, should alleviate an otherwise easily-exploitable context length imbalance between offense and defense.</p>

<p>Another core argument in favor of compaction monitors is that they can be run online without costing any extra time. I have a strong bias toward control protocols that could realistically be folded into internal deployments. If we can launch a monitor at the same time as we launch a compaction process that already takes a minute or two, we can potentially get significant safety uplift from approximately doubling the compute we spend every compaction. That’s non-negligible expense, but it wouldn’t impact the latency of the tool to the researcher, which seems to me to be the more important factor.</p>

<p>We could implement this relatively cheaply by using a cheap monitor, and only applying more expensive/annoying interventions if its suspicion score is above a certain level. This shouldn’t harm performance or latency, and it should give some reasonably good insight into agent behavior. I could imagine a future, expensive version of this in which we use compaction by a trusted model (perhaps activated by a turn-by-turn model logging a sufficiently high suspicion score) as a control protocol. This could be a hard-core way to break sophisticated sabotage behavior, although it might trade off too negatively against general capabilities by making the summaries less useful for continuing the legitimate long-horizon task and by slowing the untrusted model down too much.</p>

<p><em>Thanks to Rhys Ward for offering some feedback on this piece.</em></p>

<div class="footnotes" role="doc-endnotes">
  <ol>
    <li id="fn:0" role="doc-endnote">
      <p>Riding along on compaction removes some of the fussiness around monitor scheduling, but is potentially brittle. Better agents will presumably be able to do more with fewer tokens. They will almost certainly also have bigger context windows. Therefore, we might need to adjust this approach to fire more frequently than actual compaction or fire compaction artificially often. Also, the majority of our settings are based on post-training tasks (see <a href="https://posttrainbench.com/">PostTrainBench</a>). <a href="#fnref:0" class="reversefootnote" role="doc-backlink">&#8617;</a></p>
    </li>
    <li id="fn:1" role="doc-endnote">
      <p>We should empirically determine whether including the input, the output, or both together performs best, and if including both is best, we should set the compaction threshold such that both fit in the monitor’s context window. <a href="#fnref:1" class="reversefootnote" role="doc-backlink">&#8617;</a></p>
    </li>
    <li id="fn:2" role="doc-endnote">
      <p>I know this isn’t perfectly true, e.g., some bash script outputs or file reads/writes are truncated, but those exceptions feel like, well, exceptions rather than the norm, and could be logged automatically as targets for future scrutiny. <a href="#fnref:2" class="reversefootnote" role="doc-backlink">&#8617;</a></p>
    </li>
  </ol>
</div>]]></content><author><name></name></author><summary type="html"><![CDATA[There are a bunch of different ways to do monitoring against sabotage/sandbagging/general bad behavior (see here for some recent-ish work on monitoring I co-authored). My KISS monitoring strategy used to be “chuck the whole transcript at a monitor LM and see what happens”. But in our current work on controlling long-horizon AI R&amp;D, the untrusted agents produce way more tokens than we can shove into one monitor LM context window (even a Gemini-length context window). We could do turn-by-turn monitoring (and we do). We could do something more hierarchical (e.g. extract-and-evaluate) (and we do). One position I’ve been developing lately is that we should also definitely try compaction monitoring.]]></summary></entry></feed>